
BOLLINGER BANDS - TRADING WITH BOLLINGER BANDS
How to use Bollinger Bands in your stock market trading
Bollinger Bands are similar to moving average envelopes. The technical analysis difference between Bollinger Bands and envelopes is envelopes are plotted at a fixed percentage above and below a moving average, whereas Bollinger Bands are plotted at standard deviation levels above and below a moving average. Since standard deviation is a measure of volatility, the bands are self-adjusting: widening during volatile markets and contracting during calmer periods.
Bollinger Bands are a technical analysis tool invented by John Bollinger
Bollinger Bands are usually displayed on top of security prices, but they can be displayed on an indicator. As with moving average envelopes, the basic interpretation of Bollinger Bands is that prices tend to stay within the upper- and lower-band. The distinctive characteristic of Bollinger Bands is that the spacing between the bands varies based on the volatility of the prices. During periods of extreme price changes, the bands widen to become more forgiving. During periods of stagnant pricing, the bands narrow to contain prices.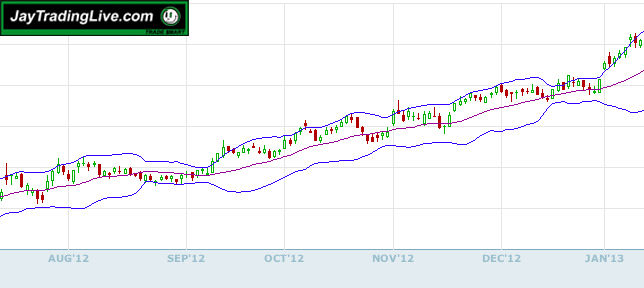
Mr. Bollinger recommends using "20" for the number of periods in the moving
average, calculating the moving average using the "simple" method and using 2 standard deviations. He has also found that moving averages of less then 10 periods do not work very well.